Will Geary created this colorful and soothing data visualization of a day's worth of subway routes around the Big Apple. The "Rhapsody in Blue" makes it nice, too!
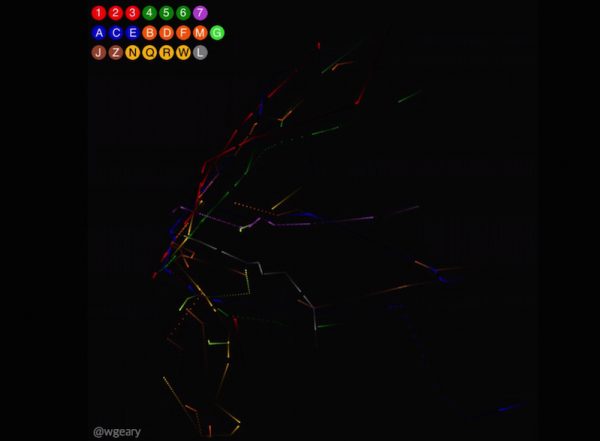

Will says it was made with Processing and Carto using data from MTA and Google Maps: "This project builds off a tutorial from Juan Francisco Saldarriaga, which can be found here."
Bonus video: Citibike activity in NYC:
•Visualizing 24 hours of subway activity in New York City (Vimeo / Will Geary)